RF-6000 - Applications
Spectrofluorophotometer

Most of the documents on the LITERATURE is available in PDF format. You will need Adobe Acrobat Reader to open and read PDF documents. If you do not already have Acrobat Reader, you can download it free at the Adobe's Website. Click the GET ADOBE READER icon on the left to download a free copy of Adobe Acrobat Reader.
Supports Applications in a Wide Variety of Fields

Evaluating the Luminous Efficiency of Solid-State Semiconductor Materials
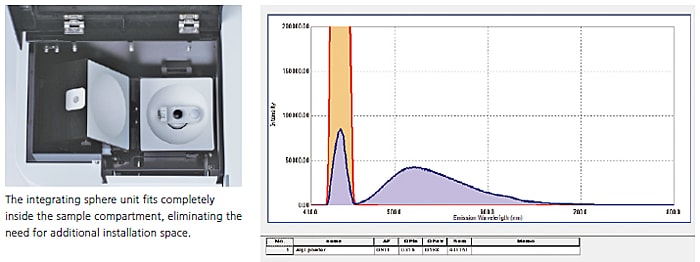
A 100 mm diameter Spectralon integrating sphere unit was used to measure the fluorescence quantum efficiency of the light-emitting layer of a solid-state semiconductor material (tris(8-hydroxyquinolinato)aluminum) used in an organic EL device. Using the quantum efficiency measurement application of LabSolutions RF software allows determining the fluorescence quantum efficiency easily using intuitive software commands.

Measuring the Fluorescence Quantum Efficiency of Solution Samples
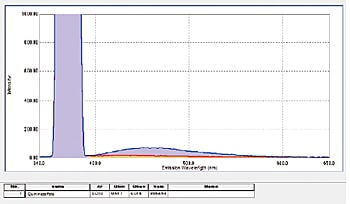
In addition to film and powder samples, the integrating sphere can secure a cuvette for measuring liquid samples. The fluorescence quantum efficiency of a 1 N aqueous sulfate solution of quinine sulfate was measured (on an NIST SRM 936a substrate). Even tedious fluorescence quantum efficiency calculations can be performed readily using the LabSolutions RF quantum efficiency measurement function.
Long Wavelength Measurements
The standard configuration can measure fluorescent wavelengths up to 900 nm, which means it can be used to research photosynthetic proteins for determining the mechanisms involved in artificial photosynthesis.
In this case, a Thylakoid membrene solution was measured.*1, 2
The fluorescence spectrum shows that the system can accurately measure the fluorescence peaks in the long wavelength region. A spectral correction function, allowing the accurate measurement of spectral shapes in real time, is also included standard.
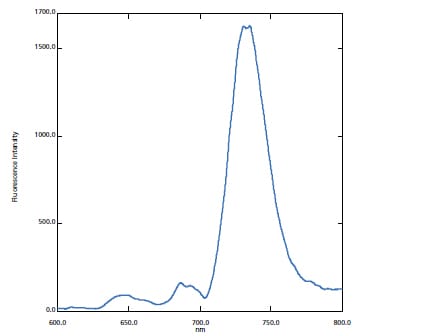
Fluorescence Spectrum of Thylakoid membrene solution Cooled by Liquid Nitrogen
| *1: | Measured with the help of professor Jian-Ren Shen of Okayama University. |
| *2: | Measured using a low-temperature measurement unit. Contact Shimadzu for further details about the low-temperature measurement unit. |
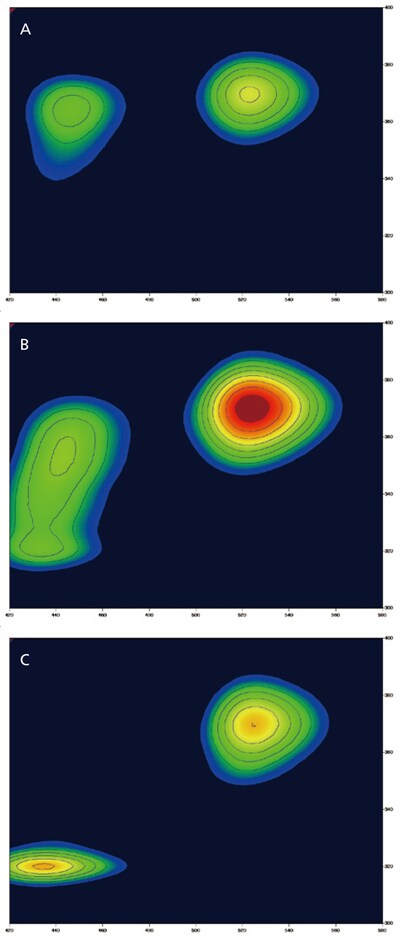
Potential for Identifying the Source of Minerals
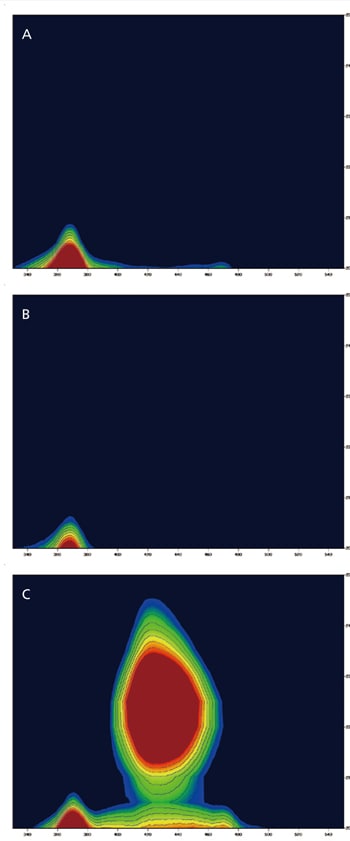
Calcite is a clear and colorless mineral consisting primarily of lime rock. Any impurities in the calcite may cause coloration. This example shows 3D fluorescence measurement (Excitation vs Emission) data for three types of calcite. Calcite A and B are clear and yellow whereas calcite C is clear and pink. 3D fluorescence patterns of calcite A and B were the same. In contrast, on the 3D fluorescence patterns of calcite C, there was a fluorescence peak at about 370 nm (EX; about 205 nm) and a strong fluorescence at about 430 nm (EX; about 225 nm). This fluorescence might be caused by metal-ions such as the manganese ion, which makes calcite pink. Because the fluorescence wavelengths caused by metal-ions are very sensitive against the size of the crystal field, they may readily show changes with mineral content.

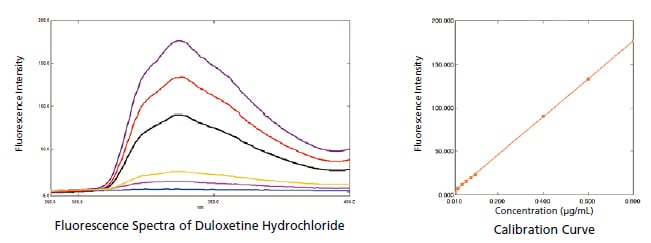
Measuring Duloxetine Hydrochloride (USP)
Duloxetine hydrochloride is a compound used as an antidepressant. In this example, an RF-6000 was used to measure duloxetine hydrochloride. The results indicated a lower limit of quantitation of 0.0007 g/mL and a lower limit of detection of 0.0002 g/mL, showing the ability of the RF-6000 to measure very low concentrations.

Fluorescent Dyes for DNA Detection
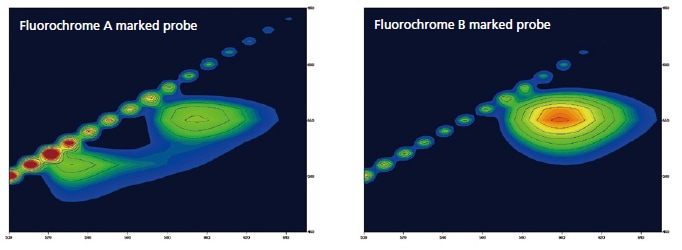
Specified complementary DNA can be detected by using a DNA probe which is marked by fluorochrome. These probes become luminescent when connected to DNA. The following shows the results of a 3D measurement of DNA marked by two different kinds of DNA probes. Unique fluorescent peaks according to specific DNA fluorescence probes can be quickly measured using the high-speed scanning function.

Classifying and Identifying Types of Milk
There are many types of milk products, such as raw or processed and those classi fied by fat content levels (low-fat, non-fat, and so on). These different types of milk products can have different 3D fluorescence spectra. In this example, three different types of milk products (A, B, and C) were used to measure 3D fluorescence spectra while varying the excitation wavelength.
Samples were diluted by five times with distilled water. The results show that milk samples A and C have different fluorescence patterns. However, milk sample B has a fluorescence pattern that is found in both milk samples A and C. Therefore, the 3D fluorescence spectra can be used to discriminate between different types of milk products.

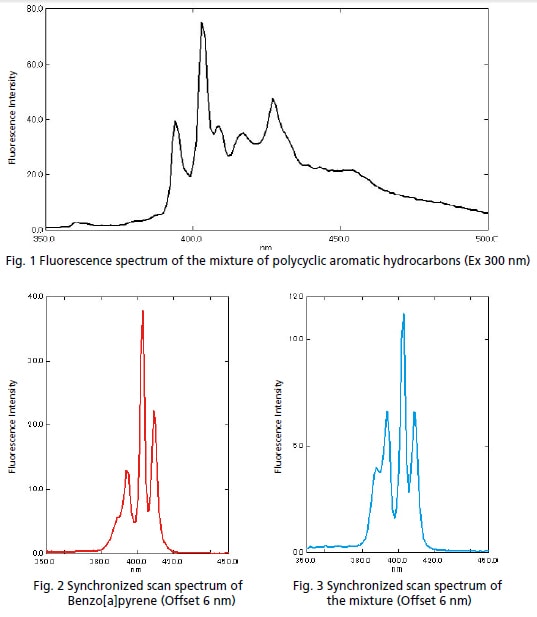
Measuring Oil in Water - ASTM D5412
The American Society for Testing and Materials (ASTM) testing standard D 5412 species testing for polycyclic aromatic hydrocarbons contained in water as oil. In this example, the target substance was separated from a solution prepared with a mixture of ve polycyclic aromatic hydrocarbons using synchronized scan*. Figure 1 is a fluorescence spectrum of the mixture of polycyclic aromatic hydrocarbones. Figure 2 is a synchronized scan spectrum of Benzo[a]pyrene. Figure 3 is a synchronized scan spectrum of the mixture.
The fluorescence peak of Benzo[a]pyrene was not distinguished in the fluorescence spectrum of the mixture; however, it was clearly separated on the synchronized scan spectrum.
* Synchronized scan
Synchronized scan mode simultaneously scans samples using both an excitation monochromator and a fluorescence monochromator that are offset by fixed wavelength intervals. Sharp fluorescence peaks can be detected for target substances even if multiple types of components are
mixed together.
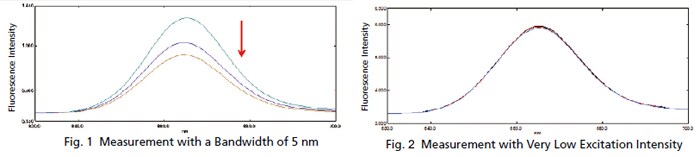
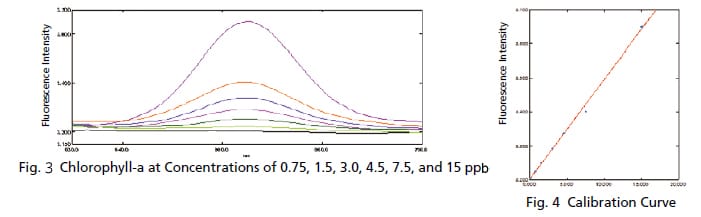
Trace Measurement of Chlorophyll
The chlorophyll content is commonly measured when inspecting the water quality of rivers and lakes. Since the concentration of chlorophyll is low in rivers and other such waters, high sensitivity is required for measurements. Chlorophyll emits fluorescent light when exposed to light, but the light exposure causes the fluorescence intensity to gradually diminish. Therefore, fluorescence measurements that apply only a slight amount of excitation light are required. If the same chlorophyll solution is measured repeatedly with a typical 5 nm bandwidth, the intensity varies as shown in Fig. 1. However, spectra with almost no variation can be obtained by narrowing a bandwidth, as shown in Fig. 2. These results show how low concentration chlorophyll solutions can be measured with good sensitivity.