LabSolutions Insight Biologics - Features
Software for Oligonucleotide Sequence Characterization
Depiction of the Structural Formula
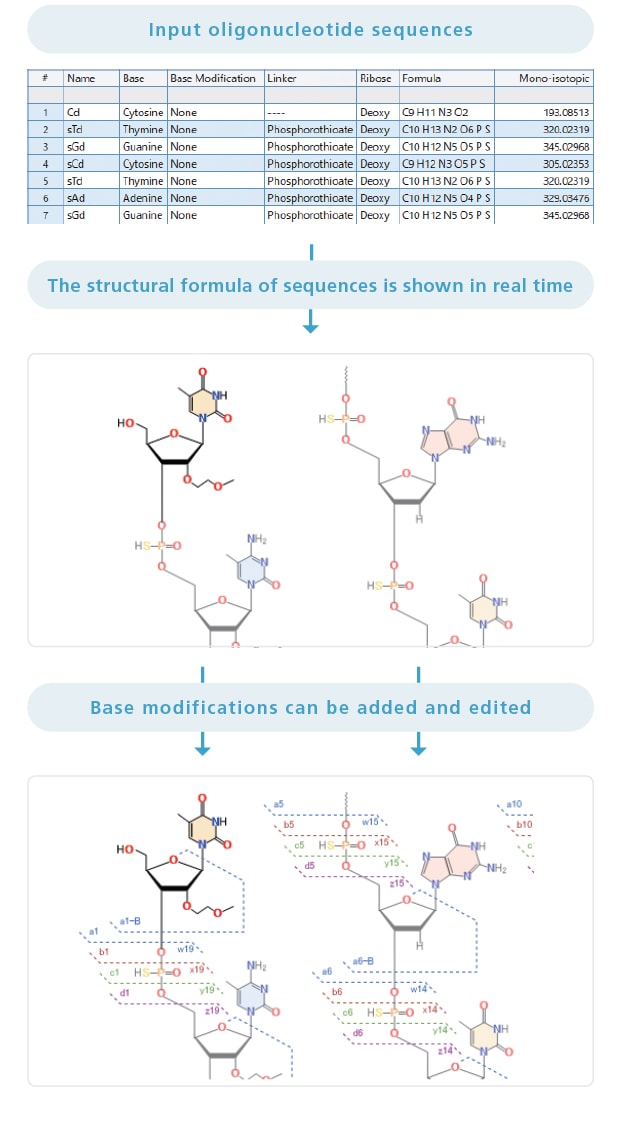
In the window for setting the oligonucleotide sequences, the structural formula of the sequence that was entered is displayed in real time, enabling quick and easy verification of the information. Also, the nucleobases used in the sequence, as well as the backbone linker, ribose, and base modifications, can be added and edited.
Component Chromatogram Display
The impurity peaks are displayed as a component chromatogram. The UV and MS chromatograms can be checked simultaneously.

Display of Fragment Coverage
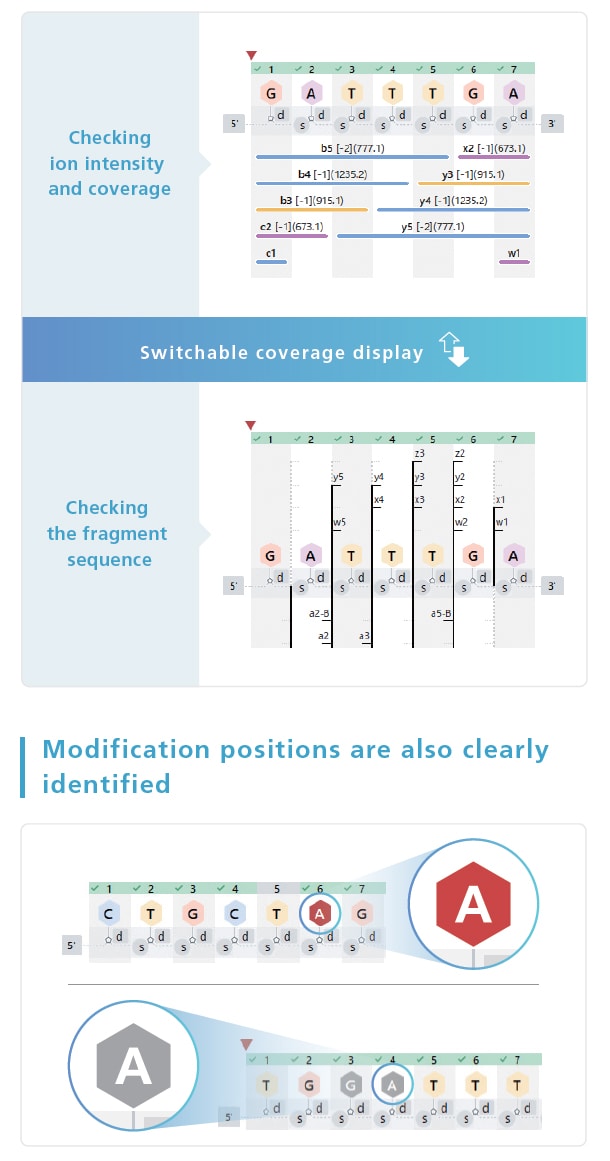
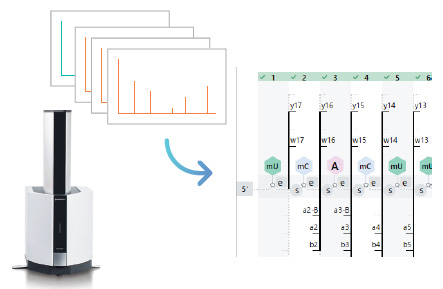
The software includes a coverage display which indicates fragment spectral assignments. The coverage display switches to match the items to be checked. Reports can also be output.
A Superior User Experience
-
LC Based Purity Calculations
Using the peak information from the MS spectrum simultaneously with the integrated LC chromatogram peaks enables purity calculations even for components that are insufficiently separated in the LC chromatogram.

-
Fragment View Function
The software includes a coverage display, which indicates fragment spectral assignments. The coverage display switches to match the items to be checked. Reports can also be output.
-
Optimization of Identification Results
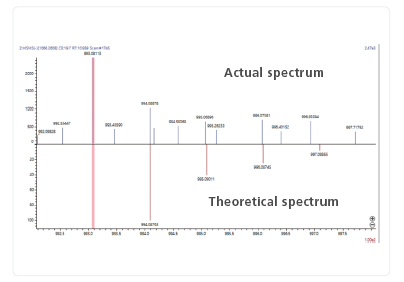
The same component is sometimes detected with multiple retention times, depending on the peak integration. The meaning of troublesome analysis results is clarified by optional optimization of the identification results. In addition, the configuration of any component can be determined from all of the detected ions, so there is no need to examine tables output for each valence.
-
Analysis Functions for Each Ionization Polarity
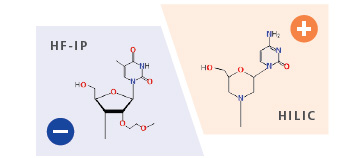
Ionization polarity enables data analysis not only from the ionization spectrum by negative polarity using ion pair reagents, which is the mainstream method, but also from the positive polarity ionization spectrum via HILIC. The software can analyze morpholino nucleic acid, which is hard to negatively ionize.
-
Efficient Analysis of MALDI Spectra
With MALDI-MS, component identification and sequence estimation are performed by selecting one identification spectrum utilizing data exported in mzML format, and up to three fragment spectra. The data analysis algorithm implemented is suited to instruments characterized by a univalent spectrum. Even if a MALDI spectrum is used, the procedures for confirming the identification results are the same as for other instruments. The software has been designed to be seamless, so there is no need to consider operation-related training costs.
-
Component Comparison Functions
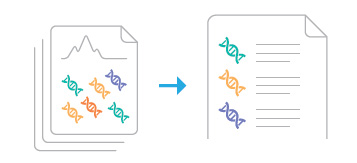
The identification results within one sample and for each batch row can easily be compared.

Data Integrity Support
LabSolutions Insight Biologics contributes to heightening the efficiency of development while managing data in accordance with the guidelines in the U.S. FDA 21 CFR Part 11, the Japanese edition of the ER/ES Guidelines, and the EU GMP Annex 11.


